Carlos A. Vazquez

Four exhibits, each built the way I'd build it on the job: the model first, the reporting over it, then the automation that keeps it running.

The model,
and the machine.

Finance · 4 exhibitsOC · --:--
Note

Every figure, company, and data point here is synthetic. "Brightloop" is a fictional SaaS/e-commerce company built as a demonstration vehicle. Nothing reflects any current or former employer's data.

Fig. 01

The driver-based model

Three-statement · forecast
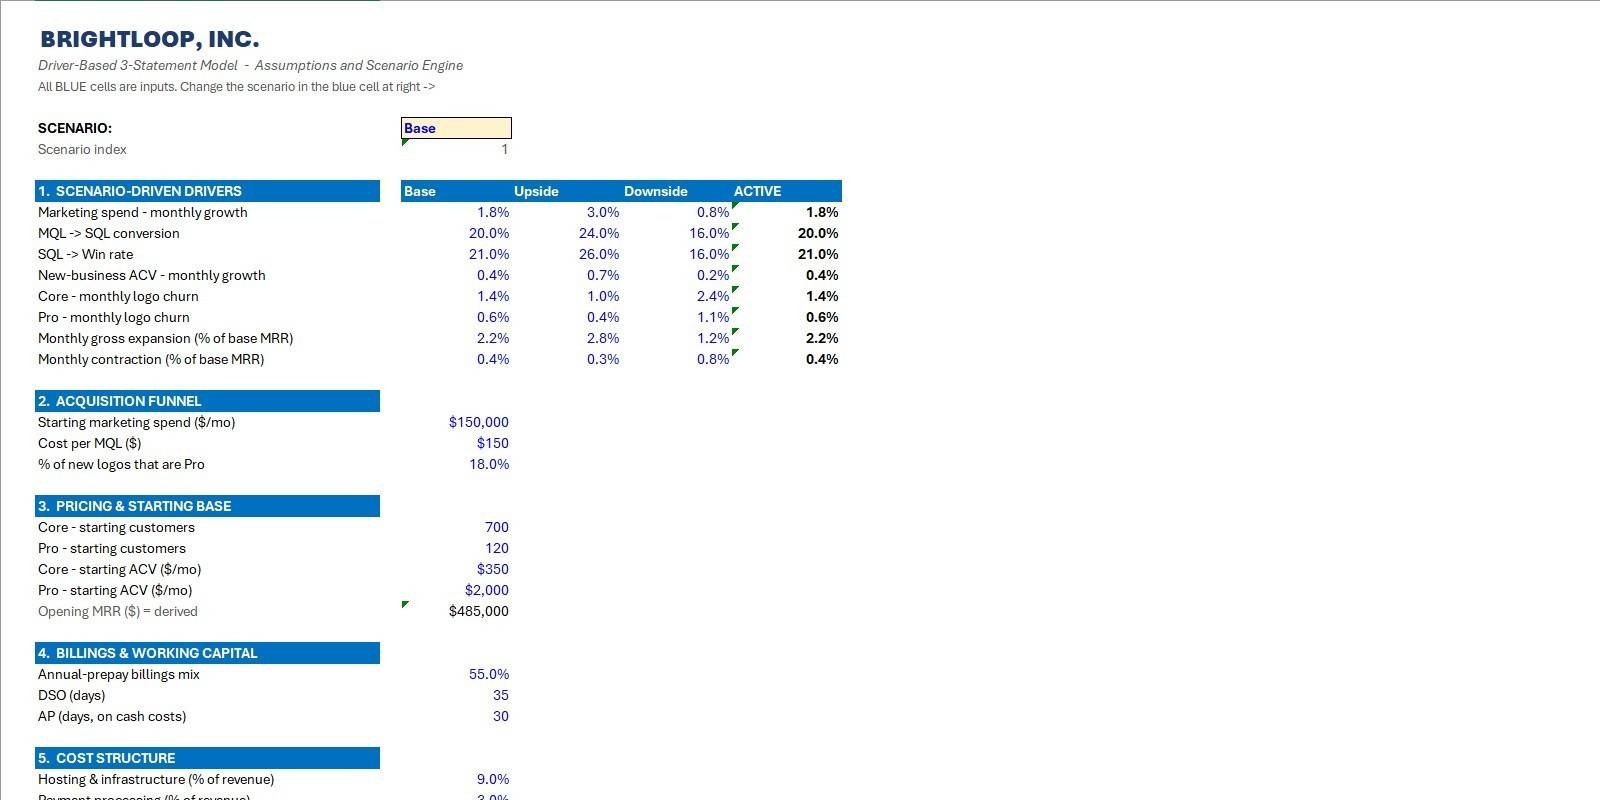
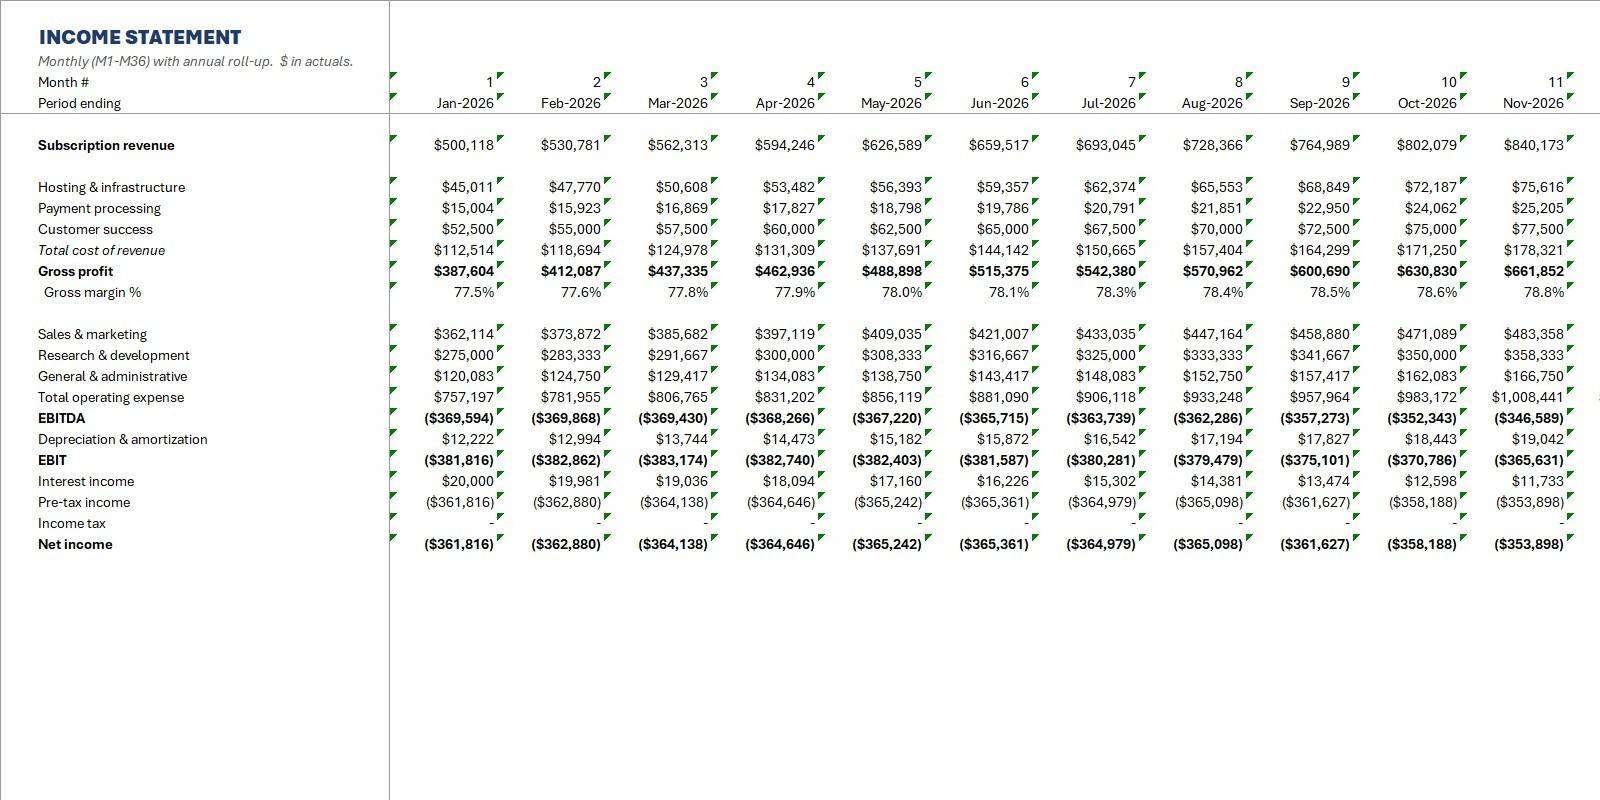
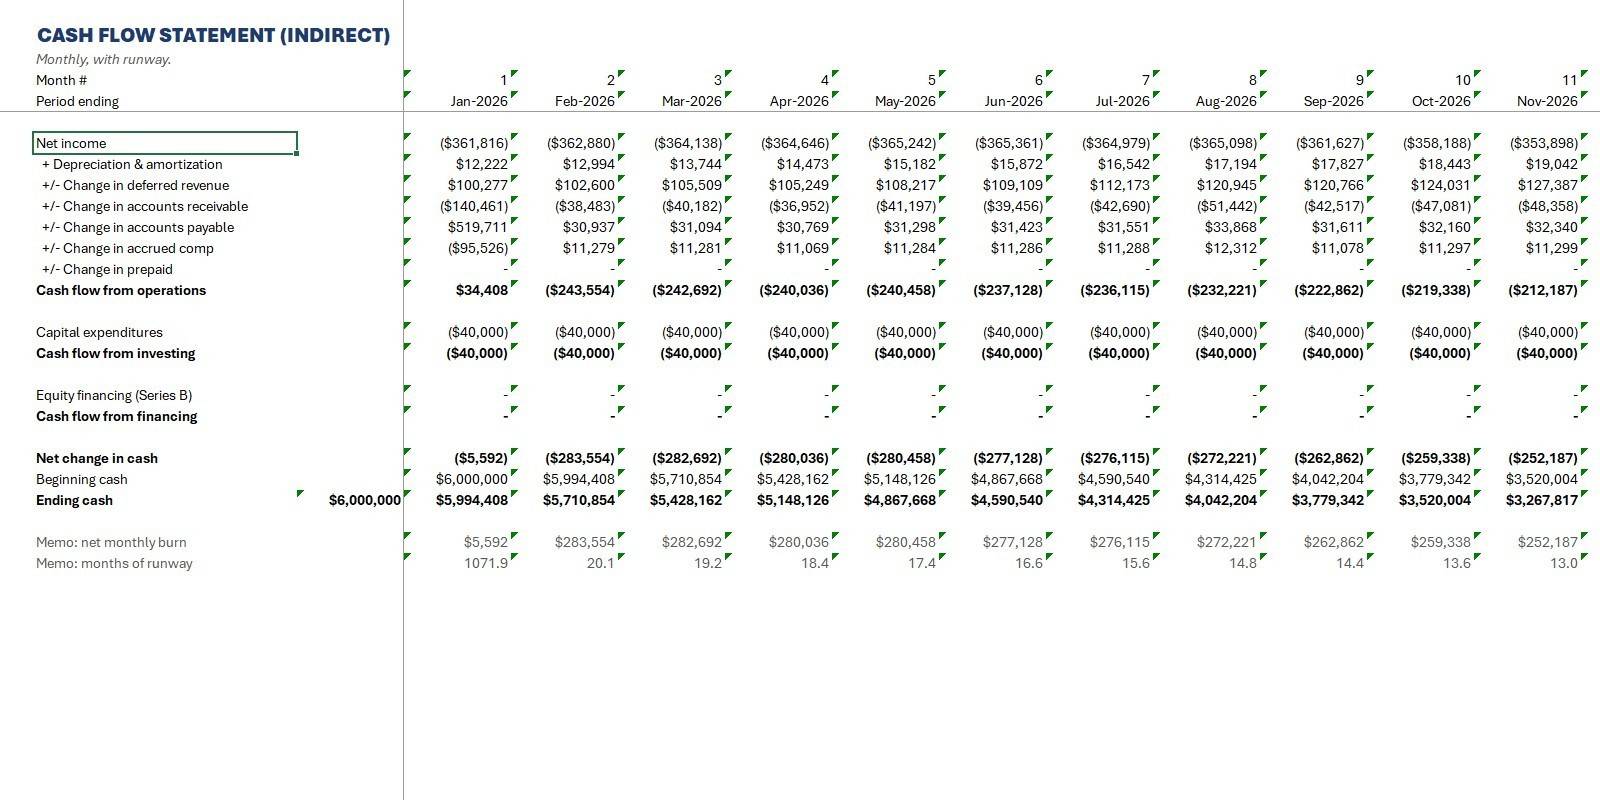
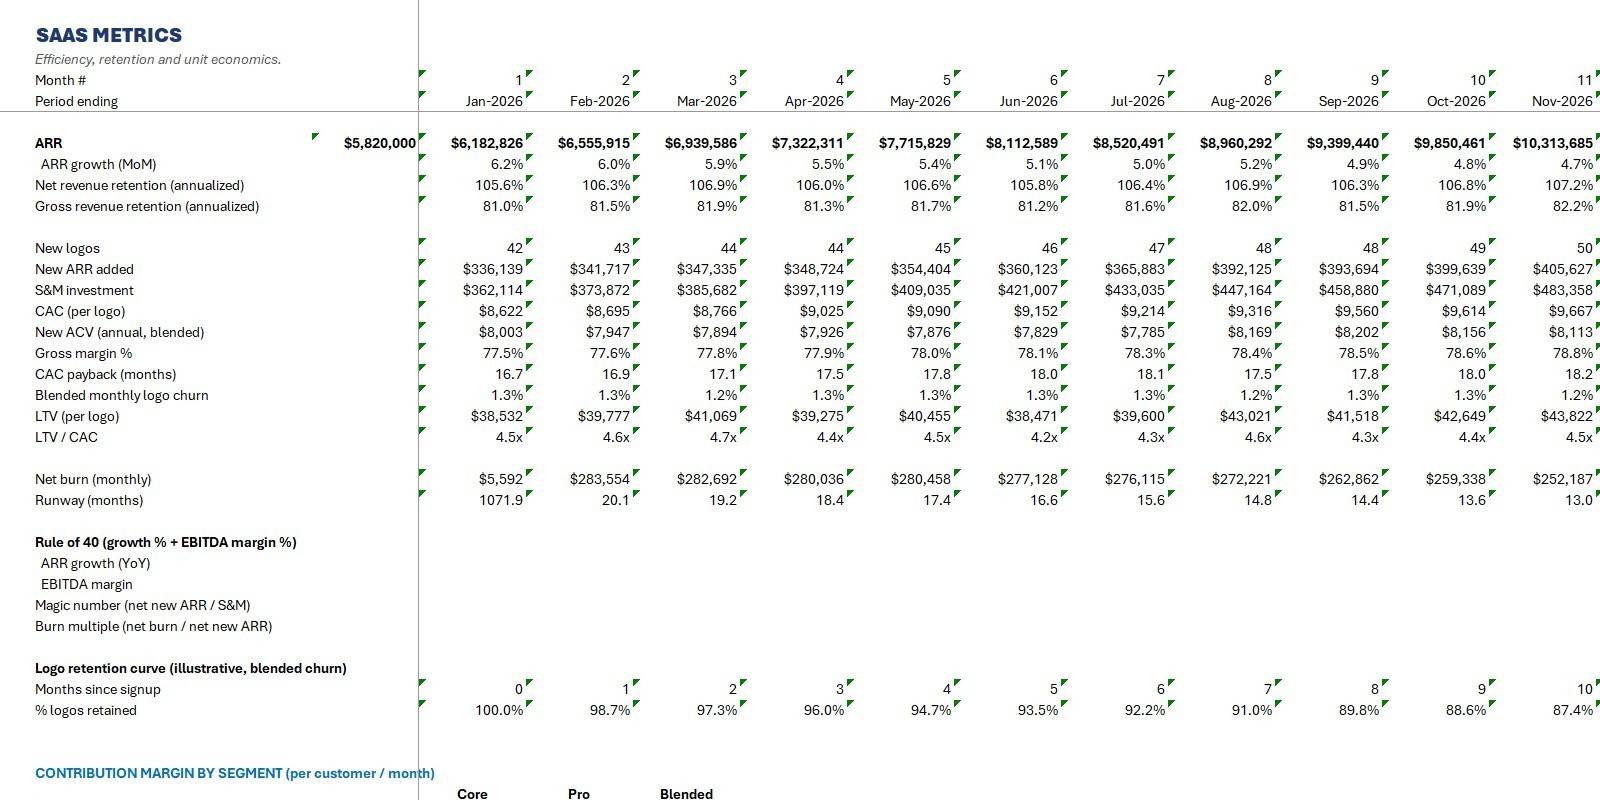
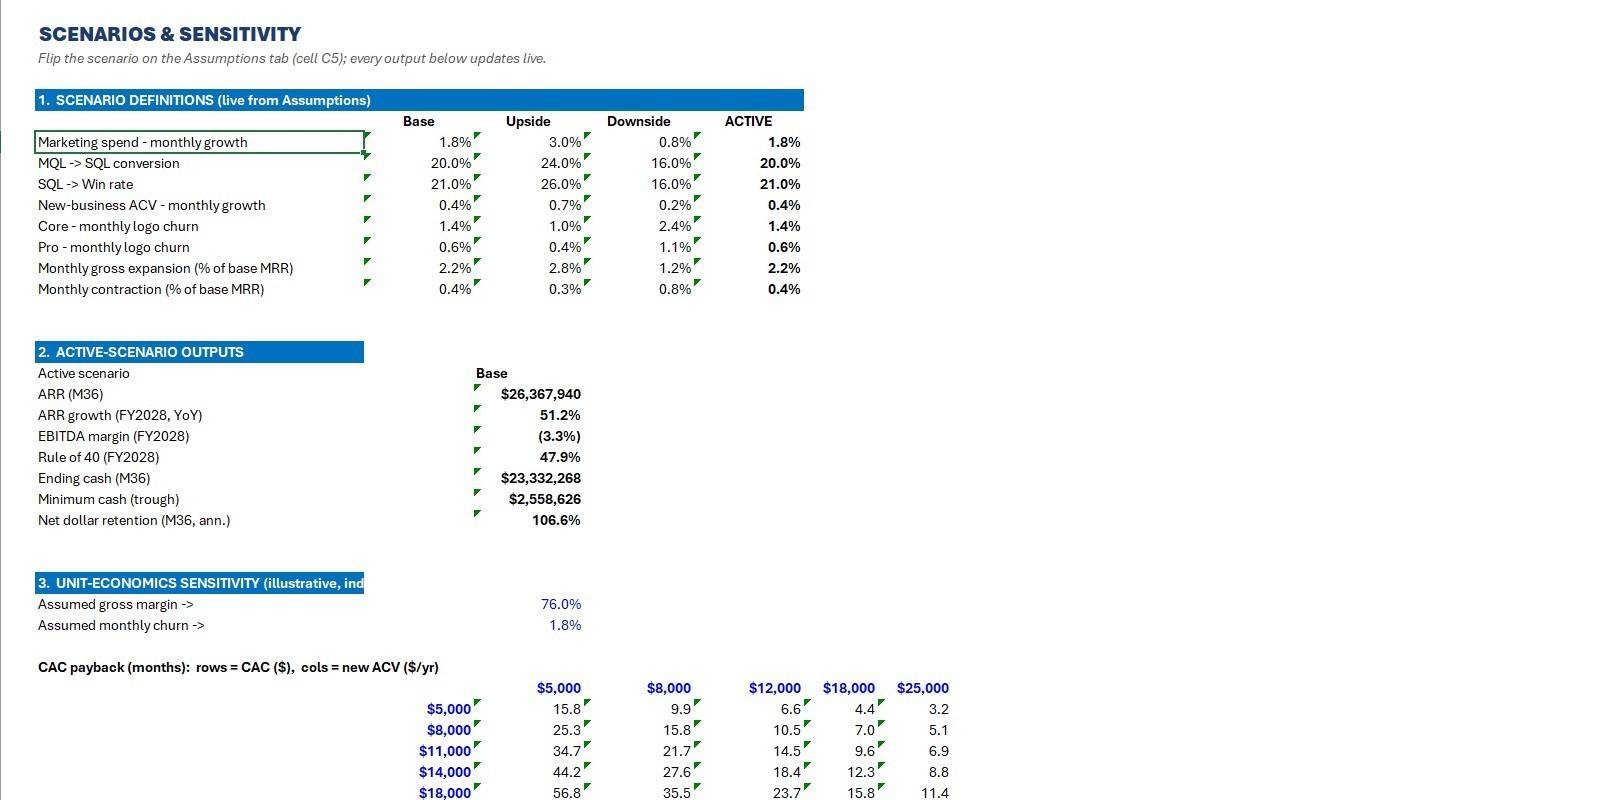
Brightloop model · Assumptions · scenario engineBrightloop model · Income statementBrightloop model · Cash flowBrightloop model · SaaS metricsBrightloop model · Scenarios
Assumptions · scenario engine01 / 05
Problem
A forecast nobody trusts is a forecast nobody uses. Assumptions buried in hardcodes, no way to test a decision before committing to it.
Approach
Ten linked tabs built off an explicit driver tree, where every output traces to an assumption you can argue with. Scenario and sensitivity layers sit on top, not bolted in later.
Shows
Modeling rigor, auditability, and structure someone else can pick up and extend.
My take
The model is often considered the most “boring” part of any effort. In truth, it's the single most foundational piece; it has to support the entire effort. To me, a model must be clean, scalable, efficient, and accountable. Every dot to every i, every t crossed. You should know where your information is coming from and why it's there.
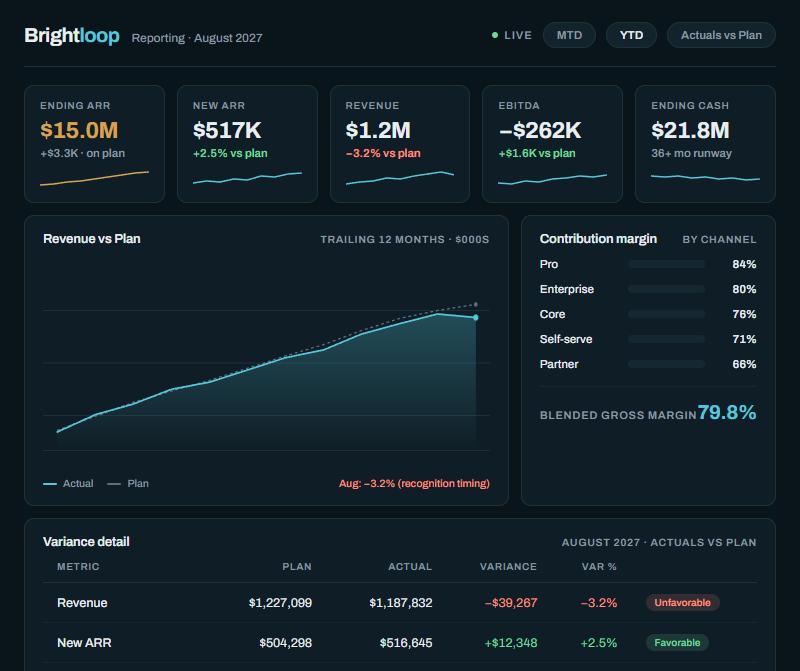
Fig. 02

The reporting layer

Web dashboard · Power BI
Brightloop · reporting dashboard
Fig. 02Brightloop · reporting dashboard
Problem
The model answers the question once. Leadership asks it again every month, usually in a slightly different shape.
Approach
A reporting layer over the same model: margin by channel, plan versus actual, the driver that moved. Built as a clean web dashboard, or in Power BI when the stack calls for it.
Shows
Turning a model into something a non-finance executive can read in about a minute.
My take
I can't tell you how many times I have heard “make it pretty” when asked to develop reporting. The look of a readout can be impressive and pleasing to the eye. That, however, is secondary to its primary purpose: It has to be useful. A good report gives you an answer, but also gives you reason to ask another question.
Fig. 03

The machine

Python · n8n
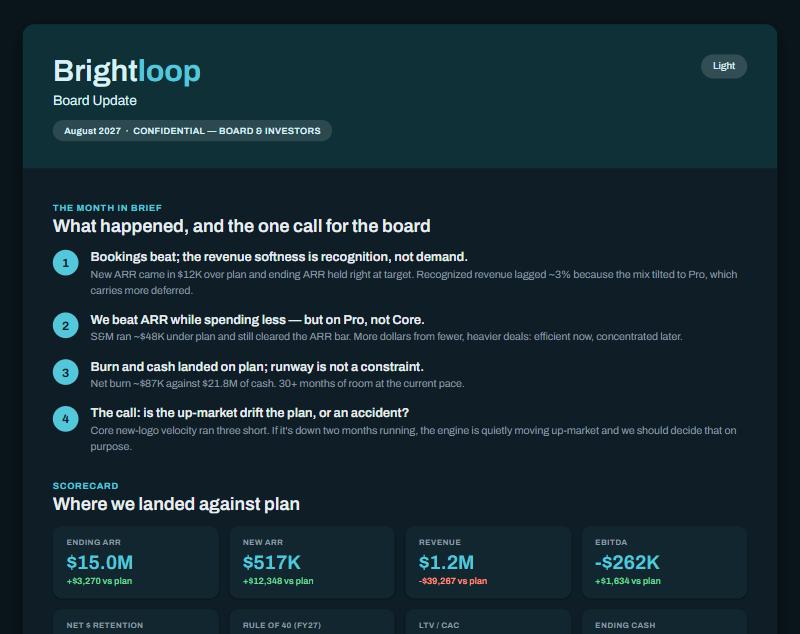
Board update · month-end
Fig. 03Board update · month-end
Problem
Building the same board update every close by hand, a week of assembling the read from numbers already sitting in a table.
Approach
At close, the pipeline reshapes the actuals and assembles a board-ready update: scorecard, ARR bridge, a drafted read. The machine does the assembly; the time goes to the one call for the board.
Shows
Automation that produces board-grade judgment, not just charts: the model and the machine, together.
My take
This is one of the most overlooked and, often, outsourced functions of the pipeline. My own path once had me studying computer science and has lent me the expertise to be able to code, automate, and simplify many time-consuming processes. Every moment you'd otherwise spend waiting on “send it to the data team” is a moment to dig in and build something useful instead. My goal is to eliminate that need altogether.
Fig. 04

How I'd approach your finance function

Framework
01
Get the model rightA driver-based three-statement model that actually ties, built on real drivers, not a template. Scenarios and sensitivities so you can see what happens before it happens. Everything else sits on this, so it goes first.
02
Make it legibleA reporting layer a founder or board can read in about a minute. The model is the truth; the dashboard is how everyone else sees it.
03
Make it run itselfActuals land, the pipeline reshapes them, flags the variances, and drafts the commentary. The close hands you a board-ready read, not just charts.
Problem
How do you show judgment, not just output?
Approach
Three moves, in order. You can stop after any one of them with something real.
Shows
Point of view, and the discipline to compress it.
My take
My goal is to use my understanding of precision, process, and presentation to enable an end-to-end solution. You keep as much as possible in your own hands, while gaining the broader viewpoint and agility that come from having the right information, delivered regularly and reliably, in a way you can understand and act on.